Is it safe for children to drink raw milk?

No. The fresh milk we typically consume in the UK is pasteurised, which means it has been heat-treated to kill any bacteria in it. However, raw milk is milk that has not been pasteurised, and as a result may contain harmful bacteria which could cause food poisoning.

Reference

https://www.food.gov.uk/safety-hygiene/raw-drinking-milk


Are there any differences between UHT and fresh animal milks?

While fresh animal milks are pasteurised (exposed to heat <100˚C to kill bacteria), ultra-heat treated milk has been heated to temperatures of 135-150˚C for a few seconds to sterilise it, before rapidly cooling it and packaging it aseptically to keep it sterile. The purpose of UHT processing is to transform a perishable product in to a long-life product. UHT milk tastes a little different to fresh milk (it has been described as a cooked taste) and is a slightly darker colour because of chemical reactions that occur during processing. There are some, limited differences in the nutritional value of UHT and fresh milks. UHT processing reduces to some extent the amount of vitamin C, folic acid and the B vitamins, but fat soluble vitamins and proteins remain unaffected.

Reference

Chavan RS, Sehrawat R, Mishra V and Bhatt S (2016). Milk: Processing of Milk. In Encyclopedia of Food and Health, Editors: Benjamin Caballero B, Finglas PM and Toldrá F. Academic Press


What are the differences between fortified fresh cows’ milks and ordinary fresh cows’ milk?

There is currently one fresh, fortified cows’ milk on the market, promoted for children aged 1-5, called Arla Big Milk. It is fortified with vitamin A (78µg per 100ml) and vitamin D (2.2µg per 100ml) and with iron (1.2mg per 100ml) and costs more than twice as much as ordinary, fresh cows’ milk.

In the UK, unfortified whole cows’ milk is recommended as the main milk drink for non-breastfed children over the age of 1 year and semi-skimmed cows’ milk is recommended from the age of 2 years. At the same time it is recommended that all children aged from 6 months to their 5th birthday have daily vitamin drops containing vitamin A (223µg/day), vitamin C (20mg/day) and vitamin D (10µg/day) (with the exception of formula fed babies consuming 500ml or more formula each day). The vitamin drops are meant to act as a nutritional safety net and are a part of the Healthy Start scheme for all pregnant women under the age of 18, and low-income pregnant women over 18 and families with at least one child under the age of 4 years old.

Arla Big Milk is fortified with a different set of micronutrients than those recommended by the NHS for all children in the UK; both the milk and the drops contain vitamins A and D (350ml of Arla Big Milk provides slightly more vitamin A than the vitamin drops alone, and slightly less vitamin D), but the milk lacks vitamin C and contains added iron.


What are the benefits of giving human milk to children over 1 year of age?

Global recommendations support continued breastfeeding into the second year of life and WHO guidance recommends all infants are breastfed for up to 2 years and beyond (WHO, 2003). The rationale for encouraging continued consumption of a milk in young children beyond 1 year of age is based on a combination of meeting energy needs (proportionally driven by the fat content), calcium requirements for bone deposition and the other nutrients that mammalian milk provides. However, in contrast to animal milks, breastmilk can offer not only nutritional benefits but significant health benefits to both mother and child. That said, whilst there is no shortage of evidence for the benefits of breastfeeding during the first year of life, there are relatively few studies that attempt to quantify the benefits of breastfeeding children over 1 year of age. Nevertheless, those that do support the idea that breastfeeding continues to provide nutrition and immunological protection, is beneficial for IQ and subsequent achievement, provides some protection against overweight and obesity later in life, and offers emotional benefits for as long as it continues. Some benefits continue to be felt beyond the period of breastfeeding (Lopez et al, 2021; NHS, 2020, Grummer-Strawn et al, 2004).

Nutrition

Breastmilk composition changes over time to meet the needs of the growing child so that whilst the volume consumed may decrease, an appropriate level of nutrients remains present and immunological protection is not compromised (LLL, 2010). Studies looking at the composition of breastmilk into the second year of lactation have reported a large degree of stability in the macronutrient content with only a small reduction in protein. Mineral elements stay largely stable, although after two years, some studies report a reduction in calcium and zinc content.

Four hundred millilitres of mature breastmilk can meet the following percentage of daily nutrient requirements for a 1-2 year old child:

•           32% energy

•           36% protein

•           58% vitamin A

•           53% vitamin C


Immunological protection

Studies in breastmilk composition in the second year of lactation have reported inconsistent results. Some studies report increasing concentrations of the antimicrobial protein lysozyme (Perrin et al, 2017; Hennart et al, 1991; Prentice et al,1984). Perrin at al also reported increasing concentrations of immunoglobin A (IgA) and lactoferrin (Perrin et al, 2017). These breastmilk proteins provide responsive and protective immunity (Breakey et al, 2015) and support the development of a beneficial gut microflora (Mastromarino et al, 2014). The secretion of antimicrobial proteins differs between mothers and this may mask changes over time and may help to explain differences between studies (Perrin et al, 2017; Lewis-Jones et al, 1985). More consistently, results of a systematic review and meta-analysis indicate that breastfeeding protects against acute otitis media until 2 years of age, and protection is greater for breastfeeding of longer duration (Bowatte et al, 2015).

IQ and general ability

Research on the relationship between cognitive achievement (i.e. IQ scores and school grades) and breastfeeding has shown the greatest gains for those children breastfed the longest. Some studies show that participants who were breastfed for 12 months or more score higher on IQ and general ability tests than those with shorter durations of breastfeeding (Victora et al, 2015; Lopez et al, 2021). The positive influence on IQ as a result of breastfeeding may also impact upon long-term earnings and productivity. One large retrospective cohort study reported that participants who were breastfed for 12 months or more had higher IQ scores, more years of education, and higher monthly incomes than did those who were breastfed for less than 1 month (Victora et al, 2015).

Overweight and obesity

It is becoming widely accepted that breastfeeding protects against overweight (Victora et al, 2016). Analysis of 2015-2017 surveillance data collected in 22 European countries reported that, compared to children who were breastfed for at least 6 months, the odds of living with obesity were significantly higher among children never breastfed or breastfed for less than 6 months. Several studies have reported that longer durations of breastfeeding are associated with a lower risk of obesity in later life (Qiao et al, 2020; Zheng et al, 2020; Rito et al, 2019; Horta et al, 2015). 

A dose response relationship between breastfeeding and protection against overweight and obesity has been reported by several studies (Qiao et al, 2020; Grummer-Strawn and Mei, 2004) and those that have included a breastfeeding duration category of 12 months + have reported significant reductions in risk for overweight and obesity in later childhood. When comparing those who were breastfed for at least 12 months with those who were never breastfed, Von Kreis et al reported a 57% reduction in the odds of being overweight in a subset of over 9,300 Bavarian 5- and 6-year-olds (Von Kries et al, 1999). When comparing those who were breastfed for more than 12 months to those breastfed for less than 6 months, Liese et al reported a 20% reduction in odds of being overweight among children between 9 and 10 years of age (Liese et al, 2001). A much larger national analysis of longitudinal data drawn from the US Centers for Disease Control and Prevention Pediatric Surveillance System reported a 51% reduced risk of obesity for white non-Hispanic children who were breastfed for more than 12 months compared to those never breastfed (Grummer-Strawn and Mei, 2004). 

Emotional and psychological benefits

Whilst there are a number of studies that examine the cognitive and emotional development of infants who have been breastfed and subsequent IQ, there are few that examine development and behaviour patterns of children breastfed beyond one year. There is some evidence from a small observational study of matched pairs of mothers and their babies breastfed for either less than or greater than 1 year that breastfeeding into the second year may improve behavioural traits such as sleep disorders and temper tantrums. Benefits reported for longer breastfeeding duration were improved communication, personal-social and cognitive development (Abul-Fadl et al, 2005).

References

Abul-Fadl AAM, Fahmy EM, Kolkaliah N and Narouz N (2005). The Psychological Benefits of Continued Breastfeeding into The Second Year for Mother and Child. The International Journal of Child Neuropsychiatry, 2, (2), 143-153

Bowatte G, Tham R, Allen KJ, et al. (2015). Breastfeeding and childhood acute otitis media: a systematic review and meta-analysis. Acta Paediatrica 104 (467), 85-95. DOI: 10.1111/apa.13151.

Breakey AA, Hinde K, Valeggia CR, et al. (2015). Illness in breastfeeding infants relates to concentration of lactoferrin and secretory Immunoglobulin A in mother’s milk. Evolution, Medicine, and Public Health 1, 21–31.

Grummer-Strawn LM and Mei Z (2004). Does breastfeeding protect against pediatric overweight? Analysis of longitudinal data from the Centers for Disease Control and Prevention Pediatric Nutrition Surveillance System. Pediatrics, 113 (2).

Hennart P, Brasseur D, Delogne-Desnoeck J, et al. (1991). Lysozyme, lactoferrin, and secretory immunoglobulin A content in breast milk: influence of duration of lactation, nutrition status, prolactin status, and parity of mother. American Journal of Clinical Nutrition 53, 32–39

Horta BL et al. (2015). Long-term consequences of breastfeeding on cholesterol, obesity, systolic blood pressure and Type 2 diabetes mellitus: a systematic review and meta-analysis, Acta Paediatrica, 104 pp. 30-37.

La Leche League. Breastfeeding beyond a year. https://www.laleche.org.uk/breastfeeding-beyond-a-year/ Accessed 15/06/2021

La Leche League International. (2010). The Womanly Art of Breastfeeding. 8th Edition, 191.

Liese AD, Hirsch T, von Mutius E, et al. (2001). Inverse association of overweight and breast

Lopez DA, et al. (2021). Breastfeeding Duration Is Associated With Domain-Specific Improvements in Cognitive Performance in 9–10-Year-Old Children. Frontiers in Public Health. doi.org/10.3389/fpubh.2021.657422

Mastromarino P, Capobianco D, Campagna G, et al. (2014). Correlation between lactoferrin and beneficial microbiota in breast milk and infant’s feces. BioMetals 27, 1077–1086

NHS (2020). What To Feed Young Children.  Available at: https://www.nhs.uk/conditions/baby/weaning-and-feeding/what-to-feed-young-children/ (Accessed 25 May 2021).

Perrin MT, Fogleman AS, Newburg DS and Allen JC (2017). A longitudinal study of human milk composition in the second year postpartum: implications for human milk banking. Maternal & Child Nutrition 13 (1).

Prentice A, Prentice AM, Cole TJ, et al. (1984). Breast-milk antimicrobial factors of rural Gambian mothers. I. Influence of stage of lactation and maternal plane of nutrition. Acta Paediatrica Scandinavica 73, 796.

Qiao J, Dai L, Zhang Q and Ouyang Y-Q (2020). A Meta-Analysis of the Association Between Breastfeeding and Early Childhood Obesity, Journal of Pediatric Nursing, 53, 57-66

Rito AI, Buoncristiano M, Spinelli A, et al. (2019). Association between characteristics at birth, breastfeeding and obesity in 22 countries: The WHO European Childhood Obesity Surveillance Initiative – COSI 2015/2017. Obesity Facts, 12, 226-243.

Victora CG, Bahl R, Barros AJD, et al. (2016). Breastfeeding in the 21st century: epidemiology, mechanisms, and lifelong effect. The Lancet, 387, 475-490

Victora CG, et al. (2015). ‘Association between breastfeeding and intelligence, educational attainment and income at 30 years of age: a prospective birth cohort study from Brazil’, Lancet Global Health, 3 e199-e205.

Von Kries R, Koletzko B, Sauerwald T, et al. (1999). Breast feeding and obesity: cross sectional study. BMJ. 319:147–150

WHO (2003). Global Strategy for Infant and Young Child Feeding. Geneva, WHO.

Zheng M, Cameron AJ, Birken CS et al. (2020). Early infant feeding and BMI trajectories in the first 5 years of life. Obesity, 28 (2), 339-417.


How does the nutritional composition of cows’ milk compare to that of human milk?

Human milk and cows’ milk share the same profile of nutrients, albeit in different quantities. The composition of animal and human milk is related to genetic, physiological, nutritional and environmental factors (Pietrzak-Fiećko and Kamelska-Sadowska, 2020). Giving one composition for breastmilk is not easy as breastmilk is a dynamic, living substance whose composition changes over time and during feeds and differs between mothers and populations. Maternal dietary intake, particularly fatty acids, and some micronutrients, including fat soluble vitamins, vitamin B1 and vitamin C, partly determine their content in breastmilk. Similarly, the composition of cows’ milk differs between animals and on the basis of season and feeding regime. The compositional data for breastmilk shown here is the average composition of mature breastmilk from a number of sources (noting that there is no complete data source for breastmilk in the second year). The composition for cows’ milk used here is taken from UK food composition tables which are based on averages of samples of whole cows’ milk. The typical nutritional composition of breastmilk and cows’ milk are compared in the table below.


Nutritional composition of human breastmilk and whole cow’s milk

Breastmilk vs. whole cows milk table.png

1 First Steps Nutrition Trust (2021)

2 Finglas et al. (2015)

It should be noted in the context of this comparison that breastfeeding is a normal way to feed babies and young children and breastmilk represents the standard as a bioactive and functional dietary source of macro and micronutrients, ideally composed to support the growth needs of infants and young children. Breastmilk contains all the nutrients needed by healthy infants from birth to around 6 months of age, in forms that are easily absorbed, and contains a range of protective substances tailored to each infant and young child and the environment he or she lives in. The immunological properties of breastmilk should not be disregarded. Breastmilk contains substances such as lactoferrin, a protein component that helps babies absorb nutrients and which binds iron in the gut so that pathogenic bacteria are inhibited; immunoglobulins and macrophages which protect the infant from infections; specific fatty acids which promote development; growth factors, anti-viral factors, anti-bacterial substances and living white blood cells. Whilst cows’ milk contains a similar profile of nutrients and protective proteins to human milk, it is not ideally matched to the specific requirements of human babies and children, and is never suitable as a main milk drink for infants under the age of 1 year of age.  

References

Finglas PM, Roe MA, Pinchen HM, et al. (2015). McCance and Widdowson's The Composition of Foods: Seventh Summary Edition. Cambridge: Royal Society of Chemistry. 

First Steps Nutrition Trust (2021). What are the main differences between breastmilk and infant formula? Available at: https://infantmilkinfo.org/faq/faq-types-of-infant-milk-and-ingredients/ (Accessed 25 May 2021)

Pietrzak-Fiećko R, and Kamelska-Sadowska AM. (2020). The Comparison of Nutritional Value of Human Milk with Other Mammals’ Milk. Nutrients 12, (5) 1404. https://doi.org/10.3390/nu12051404


For children aged 1-4 years old being given alternative animal milks in place of cows’ milk, what are the suggested volumes?  

All animal milks can be used as the main milk drink from 1 year of age. Given the need to balance volume with nutrient density, below we highlight some of the differences between whole (full-fat) cows’ milk and other whole animal milks and make suggestions for suitable volumes that could be offered on a daily basis.

Nutritional comparison with cows’ milk


Goats’ milk

  •   Similar energy, protein and fat content but some micronutrients occur at lower density:

o   90% lower in folate: 100ml of goats’ milk contributes just over 1% of the daily RNI for 1-3 year olds and 1% for 4 year olds, versus cows’ milk which contributes 12% of the daily RNI in 1-3 year olds and almost 9% in children 4 year olds.

o   86% lower in vitamin B12: 100ml of goats’ milk contributes 14% of the RNI for 1-3 year olds and 9% for 4 year olds, versus cows’ milk which contributes 100% of the daily RNI in 1-3 year olds, and 63% in 4 year olds.

A similar volume of goats’ milk is required to make comparable contributions to the nutrient requirements of 1-4 years olds as cows’ milk; i.e. we suggest a maximum of 350ml a day (and consider offering more food sources rich in folate and B12).

Sheeps’ milk

  • Higher in protein and contains almost twice as much fat so contains 60% more energy per 100ml. Also higher density of micronutrients:

·         70% higher in calcium: 100ml of sheeps’ milk contributes 54% of the daily RNI for 1-3 year olds and 42% for 4 year olds, versus cows’ milk which contributes 35% of the daily RNI for 1-3 year olds and 25% for 4 year olds.

·         360% higher in vitamin C: 100ml of sheeps’ milk contributes >15% of the daily RNI for vitamin C for 1-4 year olds, versus cows’ milk which contributes about 3%.

·         73% higher in vitamin A: 100ml of sheeps’ milk contributes 16% of the daily RNI for 1-4 year olds, versus cows’ milk which contributes 9%.

·         70% higher in riboflavin: 100ml of sheeps’ milk contributes 56% of the daily RNI for 1-3 year olds and 43% of the daily RNI for 4 year olds, versus cows’ milk which contributes 33% of the daily RNI for 1-3 year olds and 25% for 4 year olds.

Smaller volumes of sheeps’ milk would be required to make comparable contributions to the nutrient requirements of 1-4 years olds as cows’ milk, i.e. we suggest approximately 200-225ml a day whereas the suggested maximum amount of cows’ milk is 350ml a day.

Donkey milk

  • Lower in protein and fat so contains 40% less energy per 100ml. Also lower density of micronutrients:

·         20% lower in calcium: 100ml of donkey milk contributes 26% of the daily RNI for calcium in 1-3 year olds

·         65% lower in potassium: 100ml of donkey milk contributes 6% of the daily RNI in 1-3 year olds and 4.5% in 4 year olds, versus cows’ milk which contributes 18% in 1-3 year olds and 13% of the daily RNI for 4 year olds.

Larger volumes of donkey milk would be required to make comparable contributions to the nutrient requirements of 1-4 years olds as cows’ milk, i.e. we suggest approximately 475-500ml of donkey milk a day whereas the suggested maximum for cows’ milk is 350ml a day. As this could be a large volume for a young child, and may displace food intake, suggest donkey milk is not used as an exclusive alternative to cows’ milk.

Mares’ milk

  • Lower in protein and fat so contains about 20% less energy per 100ml. Also lower density of micronutrients:

    ·         15% lower in calcium: 100mls of mares; milk contributes 27% of the daily RNI for 1-3 year olds and 20% for 4 year olds, versus cows’ milk which contributes 35% for 1-3 year olds and 25% for 4 year olds.

    ·         65% lower in potassium: 100mls of mares’ milk contributes 6% of the daily RNI for 1-3 year olds and about 4.5% for 4 year olds, versus cows’ milk which contributes 18% for 1-3 year olds and 13% for 4 year olds.

    ·         50% lower in zinc: 100ml of mares’ milk contributes 4% of the daily RNI for 1-3 year olds and 3% for 4 year olds, versus cows’ milk which contributes 8% for 1-3 year olds and 6% for 4 year olds.

    Larger volumes of mares’ milk would be required to make comparable contributions to the nutrient requirements of 1-4 years olds as cows’ milk; i.e we suggest approximately 420ml of mares’ milk a day whereas the suggested maximum for cows’ milk is 350ml a day. As this could be a large volume for a young child and may displace food intake, suggest mares’ milk is not used as an exclusive alternative to cows’ milk.

Buffalo milk

  • Contains similar protein content but twice as much fat as cows’ milk resulting in 60% higher energy content per 100ml. Also higher micronutrient density:

·         86% higher in vitamin A: 100ml of buffalo milk contributes 17% of the daily RNI for 1-4 year olds, versus cows’ milk which contributes 9%.

·         700% higher in B6: 100ml of buffalo milk contributes 47% of the daily RNI for 1-3 year olds and 36% for 4 year olds, versus cows’ milk which contributes 6% of the dailt RNI for 1-3 years olds and 4% for 4 year olds.

·         150% higher in vitamin C: 100ml of buffaolo contributes 8% of the daily RNI for 1-4 year olds, versus cows’ milk which contributes about 3%.

Smaller volumes of buffalo milk would be required to make comparable contributions to the nutrient requirements of 1-4 years olds as cows’ milk; we suggest approximately 200-225ml a day whereas the suggested maximum amount of cows’ milk is 350ml a day.

Camel milk

  • Similar in energy and protein, though higher in total fat content (higher in PUFA). Higher micronutrient density:

·         162% higher in vitamin A: 100ml of camel milk contributes 24% of the daily RNI for 1-4 year olds, versus cows’ milk which contributes 9%.

·         200% higher in vitamin C: 100ml of camel milk contributes 10% of the daily RNI for 1-4 year olds, versus cows’ milk which contributes about 3%.

·         700% higher in vitamin D: 100ml of camel milk contributes 16% of the daily RNI for 1-4 year olds, versus cows’ milk which contributes 2%.

·         37% higher in calcium: 100ml of camel milk contributes 44% of the daily RNI for 1-3 year olds and 34% of the daily RNI for 4 year olds, versus cows’ milk which contributes 35% for 1-3 year olds and 25% for 4 year olds.

·         75% higher in zinc: 100ml of camel milk contributes 14% of the daily RNI for 1-3 year olds and 11% of the daily RNI for 4 year olds, versus cows’ milk which contributes 8% for 1-3 year olds and 6% for 4 year olds.

Because of the high fat content and higher micronutrient density of camel milk compared to cows’ milk, it may be prudent to offer smaller volumes of camel milk as an alternative to cows’ milk. However, this would mean a lower contribution to daily energy and protein RNIs, therefore we suggest camel milk is not used as an exclusive alternative to cows’ milk.


Reference

 FAO (2013). Milk and Dairy Products in Human Nutrition. Available at: http://www.fao.org/documents/card/en/c/5067e4f2-53f8-5c9a-b709-c5db17d55c20/ (Accessed 25 May 2021).


What is organic milk and does it confer any benefits compared to non-organic milk?

What is organic milk?

Milk that is labelled as organic has been certified to have been produced organically. This means that it has met the legislated standards for organic food production (European Commission, 2007). These standards aim to establish a sustainable management system for agriculture that:

·         Sustains and enhances the health of soil, water, plants and animals;

·         Contributes to a high level of biological diversity;

·         Makes responsible use of emergency and natural resources;

·         Respects high animal welfare standards;

·         Aims to produce ‘high quality’ products using processes that do not harm the environment, human health, plant health or animal health and welfare.

According to these rules, and with respect to organic milk production, cows must have plenty of space, access to pasture when the weather permits, and spend as much time outdoors as possible. There should be no routine use of antibiotics and de-wormers and cows must be fed a natural, grass-rich, organic diet.

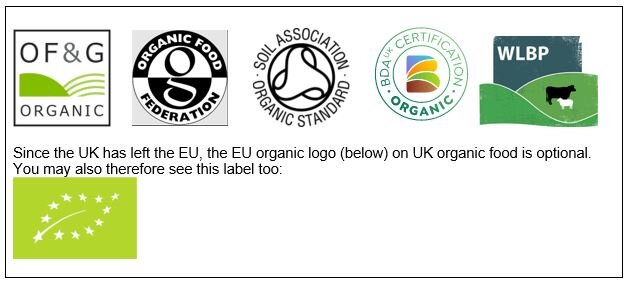
Organic milk must carry the label of the government-approved body that it has been certified by (Box 1).

Box 1: Organic food labels

FAQ What is organic milk_box1.JPG

Nutritional differences between organic milk and non-organic milk

Although being labelled as ‘organic’ is no guarantee that milk will be more nutritious, studies have found differences in the nutritional content of organic milk compared to non-organic milk, as summarised below.

Fatty acids

A meta-analysis and systematic review of the results of 170 published studies (Srednicka-Tober, 2016) found that organic milk has significantly higher concentrations of total polyunsaturated fatty acids and beneficial omega-3 fatty acids than non-organic milk, by an estimated 7% and 56% respectively. Concentrations of long chain α-linolenic acid (ALA), very long-chain n-3 fatty acids (Eicosapentaenoic acid (EPA), Docosapentaenoic Acid (DPA) and Docosahexaenoic Acid (DHA)) and conjugated linoleic acid were also significantly higher in organic milk, by an estimated 69%, 57%, and 41% respectively. As there were no significant differences in total omega-6 fatty acids and linoleic acid (LA) concentrations (which it has been suggested are present in too high concentrations in Western diets), the n-6:n-3 and LA:ALA ratios were at lower levels in organic milk, by an estimated 71% and 93% respectively. On the basis of these results, the study concluded that organic milk has a more desirable fatty acid profile compared to non-organic milk, although intervention and cohort studies would be required to quantify any potential health impacts of switching to organic milk and dairy products (Srednicka-Tober, 2016).

It should be noted that the differences in fatty acid concentrations of organic and non-organic milk tend to be smaller in wintertime when cows in organic production systems are housed (Butler, 2008) and may also be affected by climatic conditions in different geographic areas (Stergiadis, 2012). However, even taking these variations into account, organic milk still has a more desirable fatty acid profile compared to non-organic milk (Butler and Stergiadis, 2020).

There is strong evidence to show that the improved fatty acid profile of organic milk is the result of organic farms relying more heavily on pasture and forage-based feeds, rather than imported grain-based feeds (Srednicka-Tober, 2016; Benbrook, 2013; Butler, 2011). The same, or in some cases greater, benefits in respect of the fatty acid profiles may therefore be found in milk produced from pasture-fed cows (Box 1), whether organic or not. 

 Box 2:  Pasture-fed cows

FAQ What is organic milk_box2.jpg

Micronutrients

In addition to the preferable fatty acid profile of organic milk compared to non-organic milk, the same meta-analysis of 170 studies showed that organic milk has an estimated 13% higher concentration of α-tocopherol (a form of vitamin E) and 20% higher iron, but a 74% lower level of iodine and 21% lower level of selenium (Srednicka-Tober, 2016).

The much lower level of iodine in organic milk may appear concerning given that iodine is essential for brain development, particularly in early pregnancy, and because milk is the main source of dietary iodine in the UK. However, while milk contributes an estimated 47% of the iodine intakes of children aged 1.5-3 years, it provides 85% of the recommended nutrient intake for iodine (PHE, 2020). Milk and milk products together contribute an estimated 64% of the iodine intakes of children aged 1.5-3 years, contributing even more to the RNI (see our briefing note on Animal milks in the diets of 1-4 year olds here). Whether organic or pasture-fed milk and milk products or non-organic milk and milk products are chosen for children aged 1-4 years old, these should be consumed as part of a healthy, well balanced diet that includes foods that are rich in iodine, such as fish and shellfish.

Agricultural contaminants in organic and non-organic milk  

Contaminants may find their way into milk indirectly through residues of pesticides on cow feed, or as residues of veterinary drugs such as antibiotics. Evidence shows that with sufficient exposure, pesticides can contribute to delayed motor and neurological development in children (Welsh, 2019). The use of growth hormones is not permitted in the UK meaning these are not contaminants of concern.

Organic production regulations greatly limit the number of pesticides that can be used, how often and how they are used. In addition, organic production regulations stipulate that artificial fertilisers cannot be used in cow feed, and there can be no routine use of antibiotics.

However, despite more stringent controls in organic production systems, routine surveillance suggests that pesticide residues are typically absent from both organic and non-organic milk in the UK (DEFRA, 2021) added to which there are limits on antibiotic residues in all cows’ milk.


Sustainability of organic compared to non-organic milk

It is claimed that organic milk is better for the planet, wildlife and animal welfare (Soil Association, 2021).

A systematic review of 179 studies across multiple countries compared organic and non-organic livestock production systems for their sustainability (Van Wagenberg, 2017). Results showed that, compared to non-organic systems, organic systems had lower water eutrophication (water becoming full of excessive nutrients), and lower acidification (soil becoming more acidic) per unit of land. However, as organic systems were less productive than non-organic systems, acidification and eutrophication were higher per unit of product compared to non-organic systems. Conversely, organic systems had a lower negative impact on biodiversity, explained by the absence of pesticides and synthetic fertilisers, a lower stocking rate per unit of land, and a better balance between cutting, grazing and external inputs.

A total of 12 of the 179 studies reviewed assessed the impact of organic farming on climate change (Van Wagenberg, 2017). Results showed that the global warming potential (GWP) of organic and non-organic systems was the same, given that organic systems had higher enteric methane emission per unit of milk (due to the lower milk yield per cow and increased use of roughage), but lower emissions of CO2 and nitrous oxide when compared to non-organic systems. However, a study by Trydeman Knudsen (2019) found that when soil carbon changes are included in such analyses, the GWP of organic milk production came out 5-18% lower given that increased pasture feeding of cows leads to increased soil carbon sequestration. The same benefits may also in theory be applied to pasture-fed production, whether organic or not (Box 1).

In terms of animal welfare, a recent systematic review of 166 studies of animal health and welfare in organic versus non-organic production systems (Akerfeldt, 2021) found some evidence of positive effects on livestock behaviour in organic compared to non-organic systems, due to factors such as larger areas for grazing and longer outdoor periods. However, judged on the basis of a narrow set of metrics, this study reported no evidence of an effect on animal health and welfare, which were the same in organic and non-organic systems. Despite this finding it is relevant to note that compared with normal industry practice, organic standards offer many potential welfare advantages in addition to those factors outlined above, including: prohibition of tethering; prohibition of fully-slatted floors; provision of adequate bedding, shelter and shade; prohibition of electric goads; a restriction on transport duration to eight hours and prohibition of the live export of calves under one month old and of cows for slaughter; and specifications and monitoring to ensure effective pre-slaughter stunning and unconsciousness until death (CIWF and OneKind, 2012).

To summarise, the evidence we could find suggests that organic production systems are probably more sustainable and better for the environment than non-organic systems. Added to this, organic standards deliver a range of potential welfare benefits, though more research is needed to thoroughly understand how these translate consistently into health and welfare outcomes.

Cost of organic milk compared to non-organic milk

The below cost comparison between two pint cartons of semi-skimmed milk available from leading UK supermarkets (undertaken in August 2021) indicates that across these brands, the average price for two pints of non-organic milk was 73p, compared to an average price of the same volume of organic milk of 97.4p. Organic milk was between 21p and 31p more expensive within the same brand. Across the brands, on average, two pints of organic milk was 24.4p, or one third more expensive than non-organic milk. For a child consuming 350ml of milk a day over a year, the excess cost for purchasing organic milk over non-organic milk using these prices would therefore be about £28.

Table_Brands_costs.JPG

Conclusion

Organic milk is more expensive than non-organic milk, however it is likely more sustainable and better for the environment than non-organic milk and to confer some welfare advantages to the cows involved. In addition, organic milk has a more desirable fatty acid profile compared to non-organic milk, as well as higher levels of some micronutrients, but lower levels of iodine, and to a lesser extent, selenium. The same nutritional differences are likely to be seen in pasture-fed milk. Whether organic or pasture-fed milk and milk products, or non-organic milk and milk products are chosen for children aged 1-4 years old, these should be consumed as part of a healthy, well balanced diet that includes foods that are rich in iodine, such as fish and shellfish.

References 

Åkerfeldt, M.P., Gunnarsson, S., Bernes, G. et al. (2021). Health and welfare in organic livestock production systems—a systematic mapping of current knowledge. Org. Agr. 11, 105–132. https://doi.org/10.1007/s13165-020-00334-y

Benbrook, C.M., Butler, G., Latif, M.A., et al. (2013). Organic Production Enhances Milk Nutritional Quality by Shifting Fatty Acid Composition: A United States–Wide, 18-Month Study. PLoS ONE 8(12): e82429. https://doi.org/10.1371/journal.pone.0082429

Butler, G., Nielsen, J.H., Slots, T. et al. (2008). Fatty acid and fat-soluble antioxidant concentrations in milk from high- and low-input non-organic and organic systems: seasonal variation. J. Sci. Food Agric., 88, 1431-1441. https://doi.org/10.1002/jsfa.3235

Butler, G., Nielsen, J.H., Larsen, B. et al. (2011). The effects of dairy management and processing on quality characteristics of milk and dairy products, NJAS - Wageningen Journal of Life Sciences, 58, (3–4),  97-102, ISSN 1573-5214, https://doi.org/10.1016/j.njas.2011.04.002 

Butler, G. and Stergiadis, S. (2020). Chapter 5 - Organic milk: Does it confer health benefits?, Editor(s): D. Ian Givens, Milk and Dairy Foods, Academic Press, 2020, https://doi.org/10.1016/B978-0-12-815603-2.00005-X.

Compassion in World Farming and One Kind (2012). Farm assurance schemes and animal welfare: How the standards compare. https://www.ciwf.org.uk/media/5231255/standards_analysis_main_report.pdf

Davis, H., Chatzidimitriou, E., Leifert, C., and Butler, G. (2020). Evidence That Forage-Fed Cows Can Enhance Milk Quality. Sustainability  12, (9), 3688. https://doi.org/10.3390/su12093688

DEFRA (2021) Pesticide residues in food: quarterly monitoring results for 2021https://www.gov.uk/government/publications/pesticide-residues-in-food-quarterly-monitoring-results-for-2021 (accessed 15/02/2022)

European Commission (2007). Council Regulation (EC) No 834/2007 of 28 June 2007 on organic production and labelling of organic products. https://www.legislation.gov.uk/eur/2007/834/contents# (accessed 27/08/2021)

Soil Association (2021). https://www.soilassociation.org/ (accessed 27/08/2021)

Średnicka-Tober, D., Barański, M., Seal, C., et al. (2016). Higher PUFA and n-3 PUFA, conjugated linoleic acid, α-tocopherol and iron, but lower iodine and selenium concentrations in organic milk: A systematic literature review and meta- and redundancy analyses. British Journal of Nutrition, 115, (6), 1043-1060. doi:10.1017/S0007114516000349

Stergiadis, S., Leifert, C., Seal, C.J., et al. (2012). Effect of feeding intensity and milking system on nutritionally relevant milk components in dairy farming systems in the North East of England. J. Agric. Food Chem.  60, (29), 7270–7281 https://doi.org/10.1021/jf301053b 

Knudsen, M,T., Dorca-Preda, T., Djomo, S,N,. et al.  (2019). The importance of including soil carbon changes, ecotoxicity and biodiversity impacts in environmental life cycle assessments of organic and non-organic milk in Western Europe, Journal of Cleaner Production, 215, 433-443, ISSN 0959-6526, https://doi.org/10.1016/j.jclepro.2018.12.273.

Public Health England (2020). National Diet and Nutrition Survey Rolling Programme years 9-11 Combined. Data Tables. Available at: https://www.gov.uk/government/statistics/ndns-results-from-years-9-to-11-2016-to-2017-and-2018-to-2019  (accessed 13/09/2021)

Van Wagenberg, C., De Haas, Y., Hogeveen, H., et al. (2017). Animal Board Invited Review: Comparing conventional and organic livestock production systems on different aspects of sustainability. Animal, 11, (10), 1839-1851. doi:10.1017/S175173111700115X

Welsh, J.A., Braun, H., Brown, N., et al. (2019). Production-related contaminants (pesticides, antibiotics and hormones) in organic and conventionally produced milk samples sold in the USA. Public Health Nutr. 22, (16), 2972-2980. doi: 10.1017/S136898001900106X